Top Martech Tools B2B Growth Teams Need
The B2B growth landscape isn’t just about having the best tools; it’s about having the …
28/09/2023 -
9 dk okuma
Stay up to date with Peakers
Before transitioning to Google Analytics 4 (GA4) or making any installations, you should be aware that you need to change many of your past habits. Google announced a new way to merge both app and website measurements with the new platform Google Analytics 4 or GA4, alongside its plan to retire Universal Analytics in the near future, on July 31, 2019.
If you rely on Google Analytics Universal to measure your KPIs, transitioning to GA4 will have significant implications. However, being prepared is the best way to deal with the inevitable confusion and questions when the transition happens.
The purpose of this blog post is to help you understand the roadmap and the eight key differences in analytical reading between Google Analytics 4 and Universal Analytics before comparing the fundamental steps and differences.

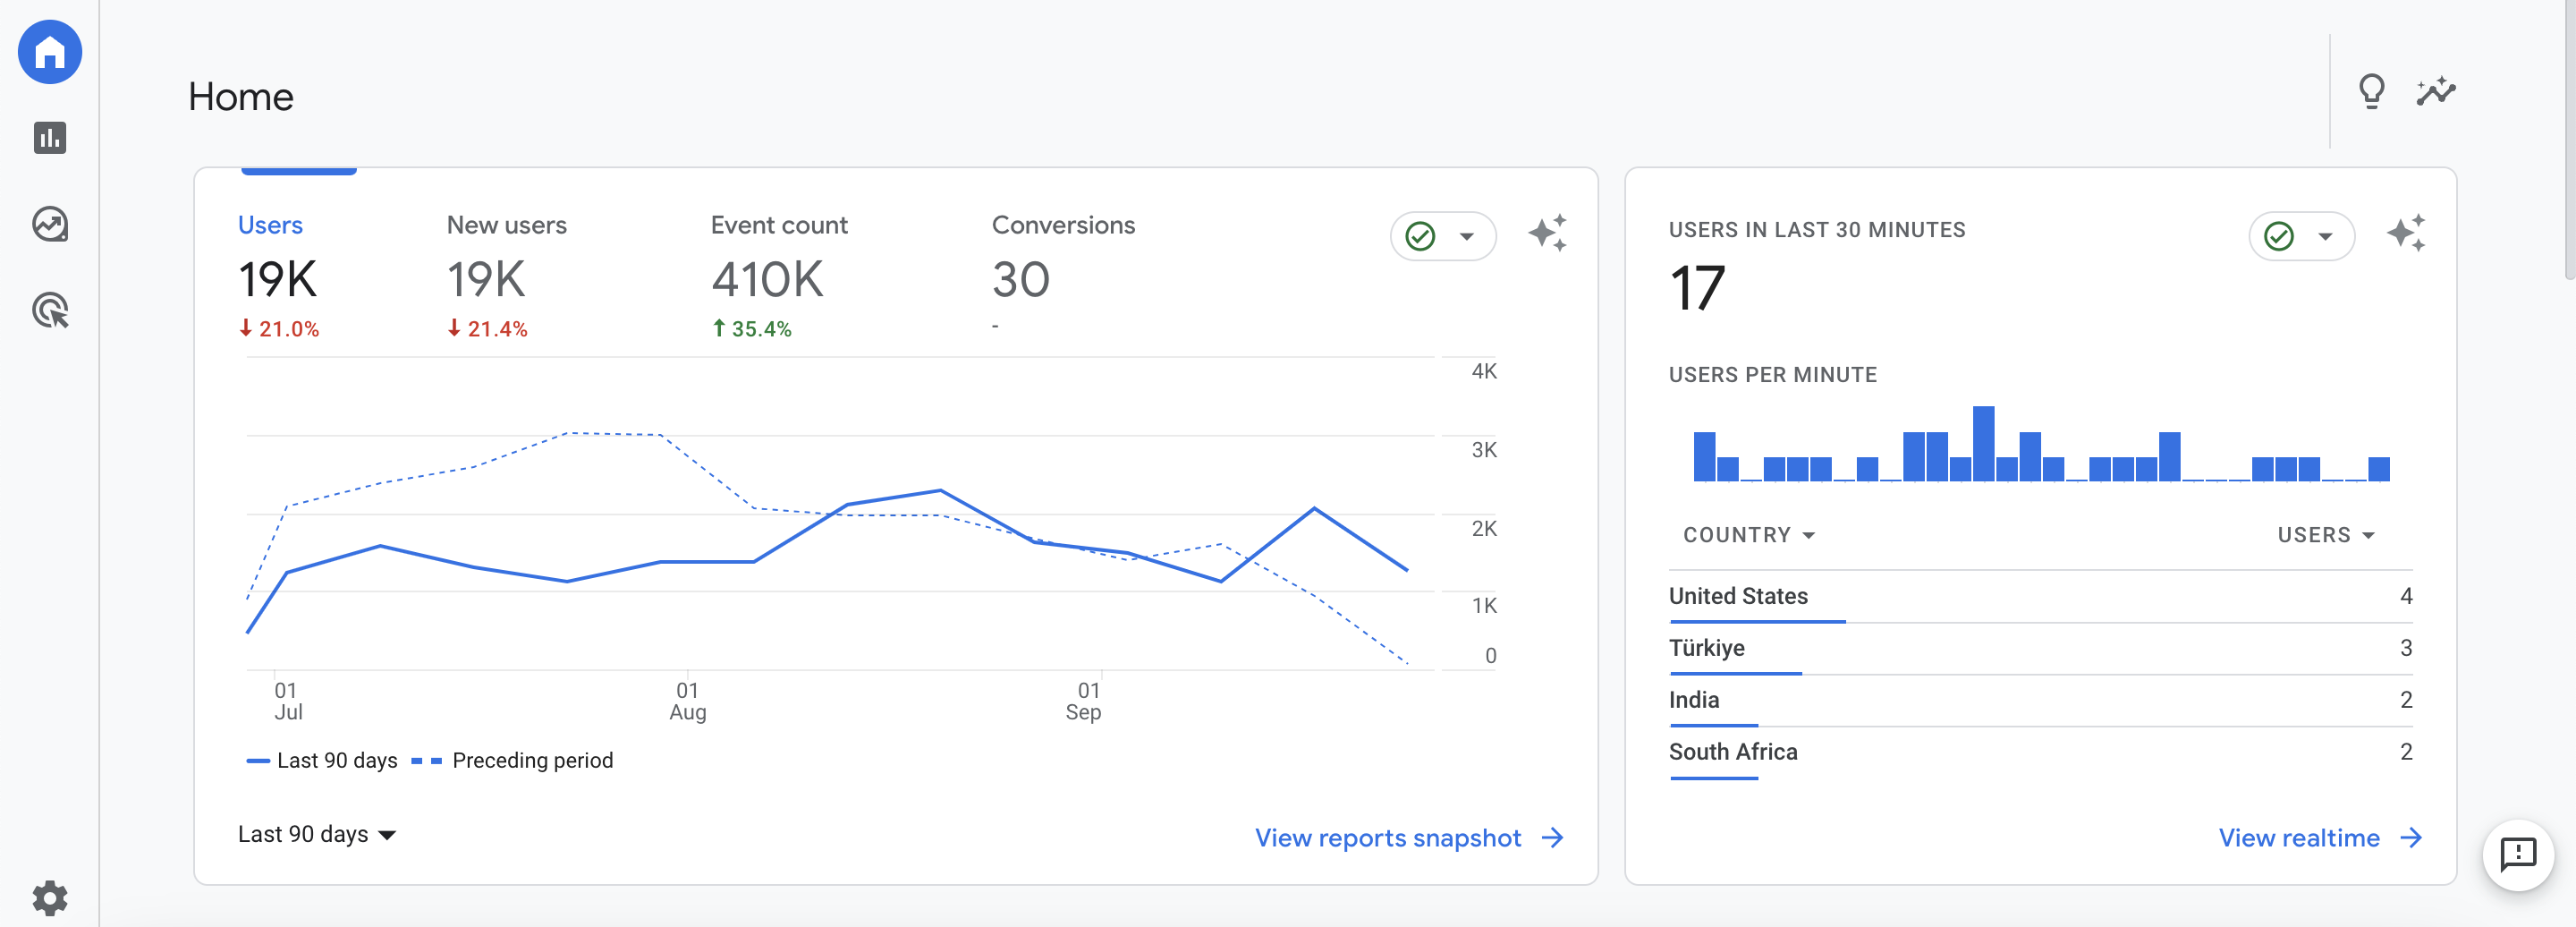
The most noticeable difference you will see in GA4 is the new interface. The GA4 interface looks very different from UA.
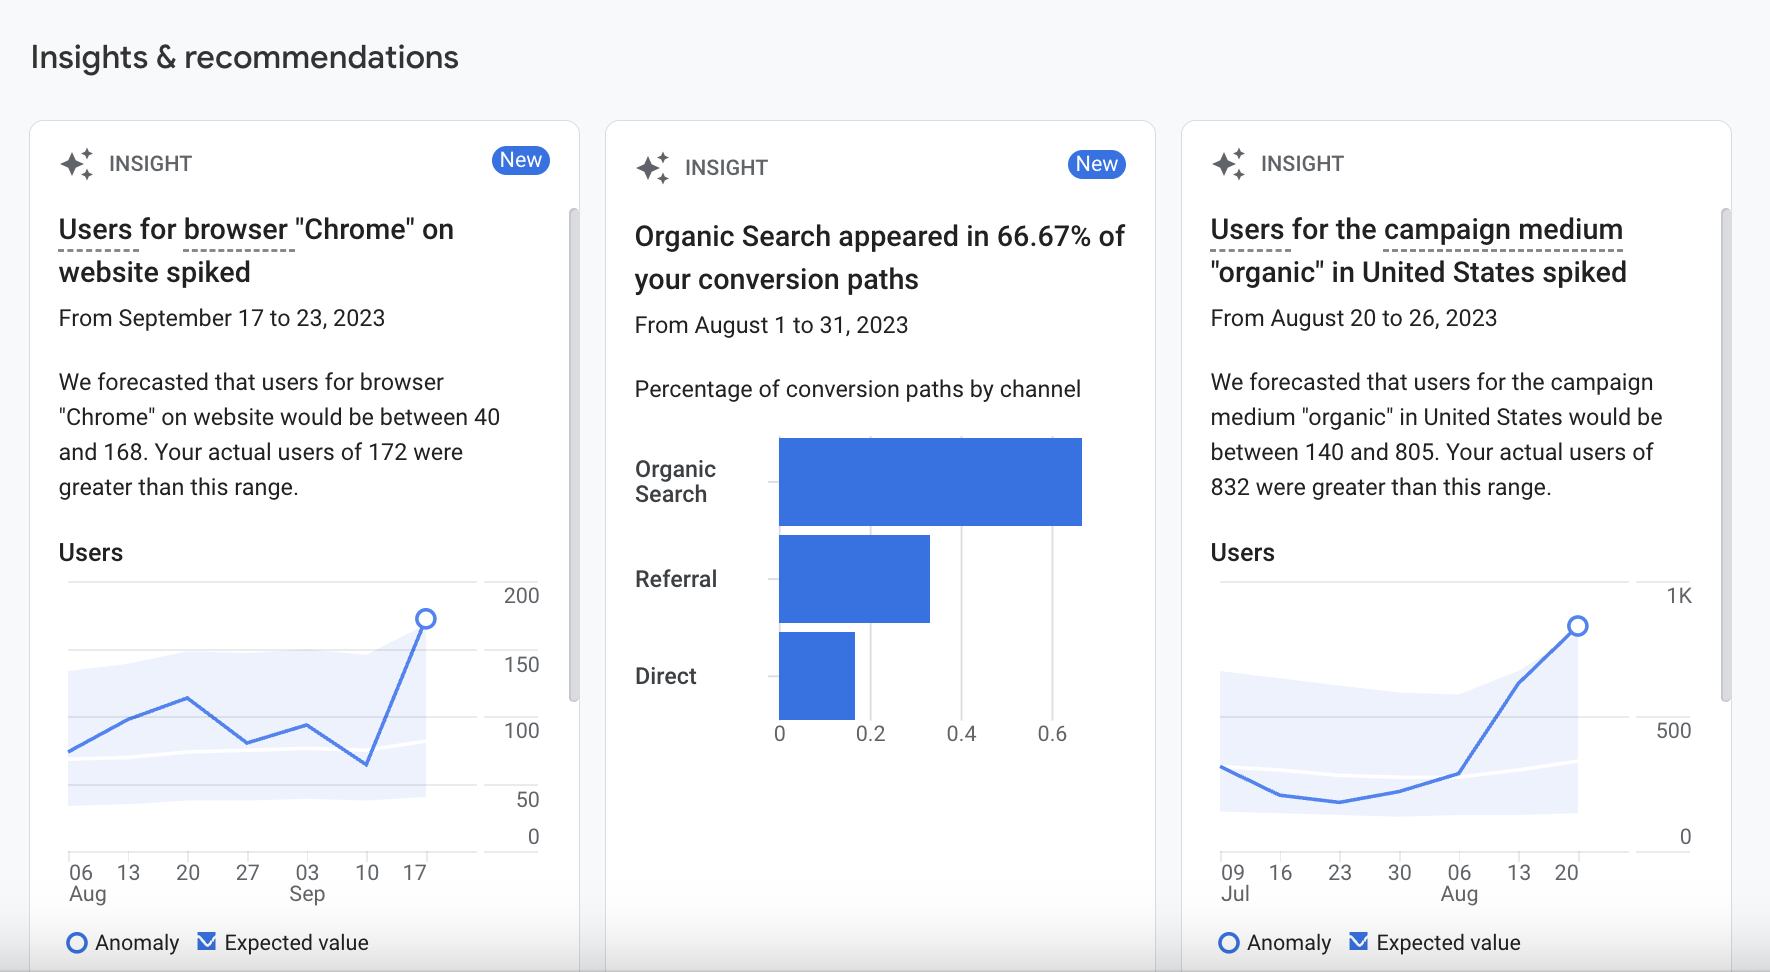
In GA4, right from the start, in the main dashboard section, you will see more data generated by Google’s “automatic analysis” feature. These analyses are created automatically using new machine learning features by Google. GA4 triggers them automatically when it detects sudden increases or decreases in your data.
When comparing Google Analytics 4 to Universal Analytics, all the navigation options in Universal Analytics are now under “Reports” in GA4. Under the Reports function, you can see where your users come from, what valuable actions they perform on your site, and much more.
Most importantly, in Google Analytics 4, there are two new navigation options: “Discovery” and “Advertising”…
Among all the changes on the platform, the most valuable one for businesses is the new Discovery Reports.
With Discovery Reports, you can track your key business metrics in much more detail compared to UA. These reports allow you to perform custom analyses and obtain insights into the performance of your app and/or website.
Discovery Reports offers various visualization options such as charts, tables, and graphs to help you better understand the data. You can also use the “Analysis” feature to apply machine learning algorithms to your data and uncover deeper insights.
Discovery Reports are particularly useful for identifying trends, monitoring user behavior, and measuring the effectiveness of your marketing campaigns. We recommend learning Google Analytics 4 Discovery Reports once you understand the basics of the new interface, as this report provides the most powerful analyses.
The Google Analytics 4 advertising report provides information on paid media efforts, focusing on attribution modeling.
GA4’s advertising report allows you to track key metrics like impressions, clicks, and conversions and analyze the data by dimensions such as ad content, campaign, or audience. It can also be used to track the cost and return on investment (ROI) of your advertising campaigns.
Most importantly, “conversion paths” allow you to see the performance of all incoming advertising campaigns, including Facebook, LinkedIn, Spotify, Google Ads, and more.
When used correctly, advertising reports can help you optimize your ad spending, refine your targeting, and increase the effectiveness of your campaigns.

Another major difference between Google Analytics 4 and Universal Analytics, aside from the initial interface differences, is the use of events in GA4.
In Google Analytics 4, every metric is an event; Universal Analytics is based on hits.
This means that in GA4, everything from page views to form submissions is treated as an event when you analyze your data.
While Universal Analytics can also record events alongside page views, GA4 provides a more comprehensive view of user behavior and interactions. This contrasts with Universal Analytics, which tracks and measures how many times a page is viewed by a user.
If you compare Google Analytics 4 to Google Universal metrics, you may notice that they are not the same. Why? There are several different answers, but the most notable one is how GA4 defines sessions.
Firstly, GA4 defines sessions as “a period of activity by a user in your app, or on your website, which starts when the user becomes active on your site or app and ends when they are inactive for a period of time.” In Universal Analytics, a session is “a group of user interactions with your website that takes place within a given time frame.”
Google also mentions that sessions in GA4 properties might be lower than in Universal Analytics properties because” Google Analytics 4 doesn’t create a new session when the campaign source changes mid-session, whereas Universal Analytics would create a new session under these circumstances.”
Secondly, GA4 sessions are based on events rather than page views. A session in GA4 is calculated based on the time between the first event and the last event.
One last note about GA4 sessions is that they come with associated metrics. Because GA4 is event-based, it introduces new session metrics within GA4 properties.
These include:
Another difference between Google Analytics 4 and Universal Analytics is how users on your site are measured.
Universal Analytics has two user metrics: total users and new users. Google Analytics 4 now has three user metrics: total users, new users, and active users.
As mentioned earlier, everything in GA4 is event-based, so user metrics are also event-based.
This translates to the following definitions:
In Google Analytics 4, the primary user metric is active users, whereas in UA, it’s total users.
Google Analytics 4 (GA4) and Universal Analytics use different methods for measuring page views, making it difficult to make a direct one-to-one comparison between the two platforms.
Page views are defined differently between the two platforms:
Please note that the unique page view metric measured in UA is not measured in GA4.

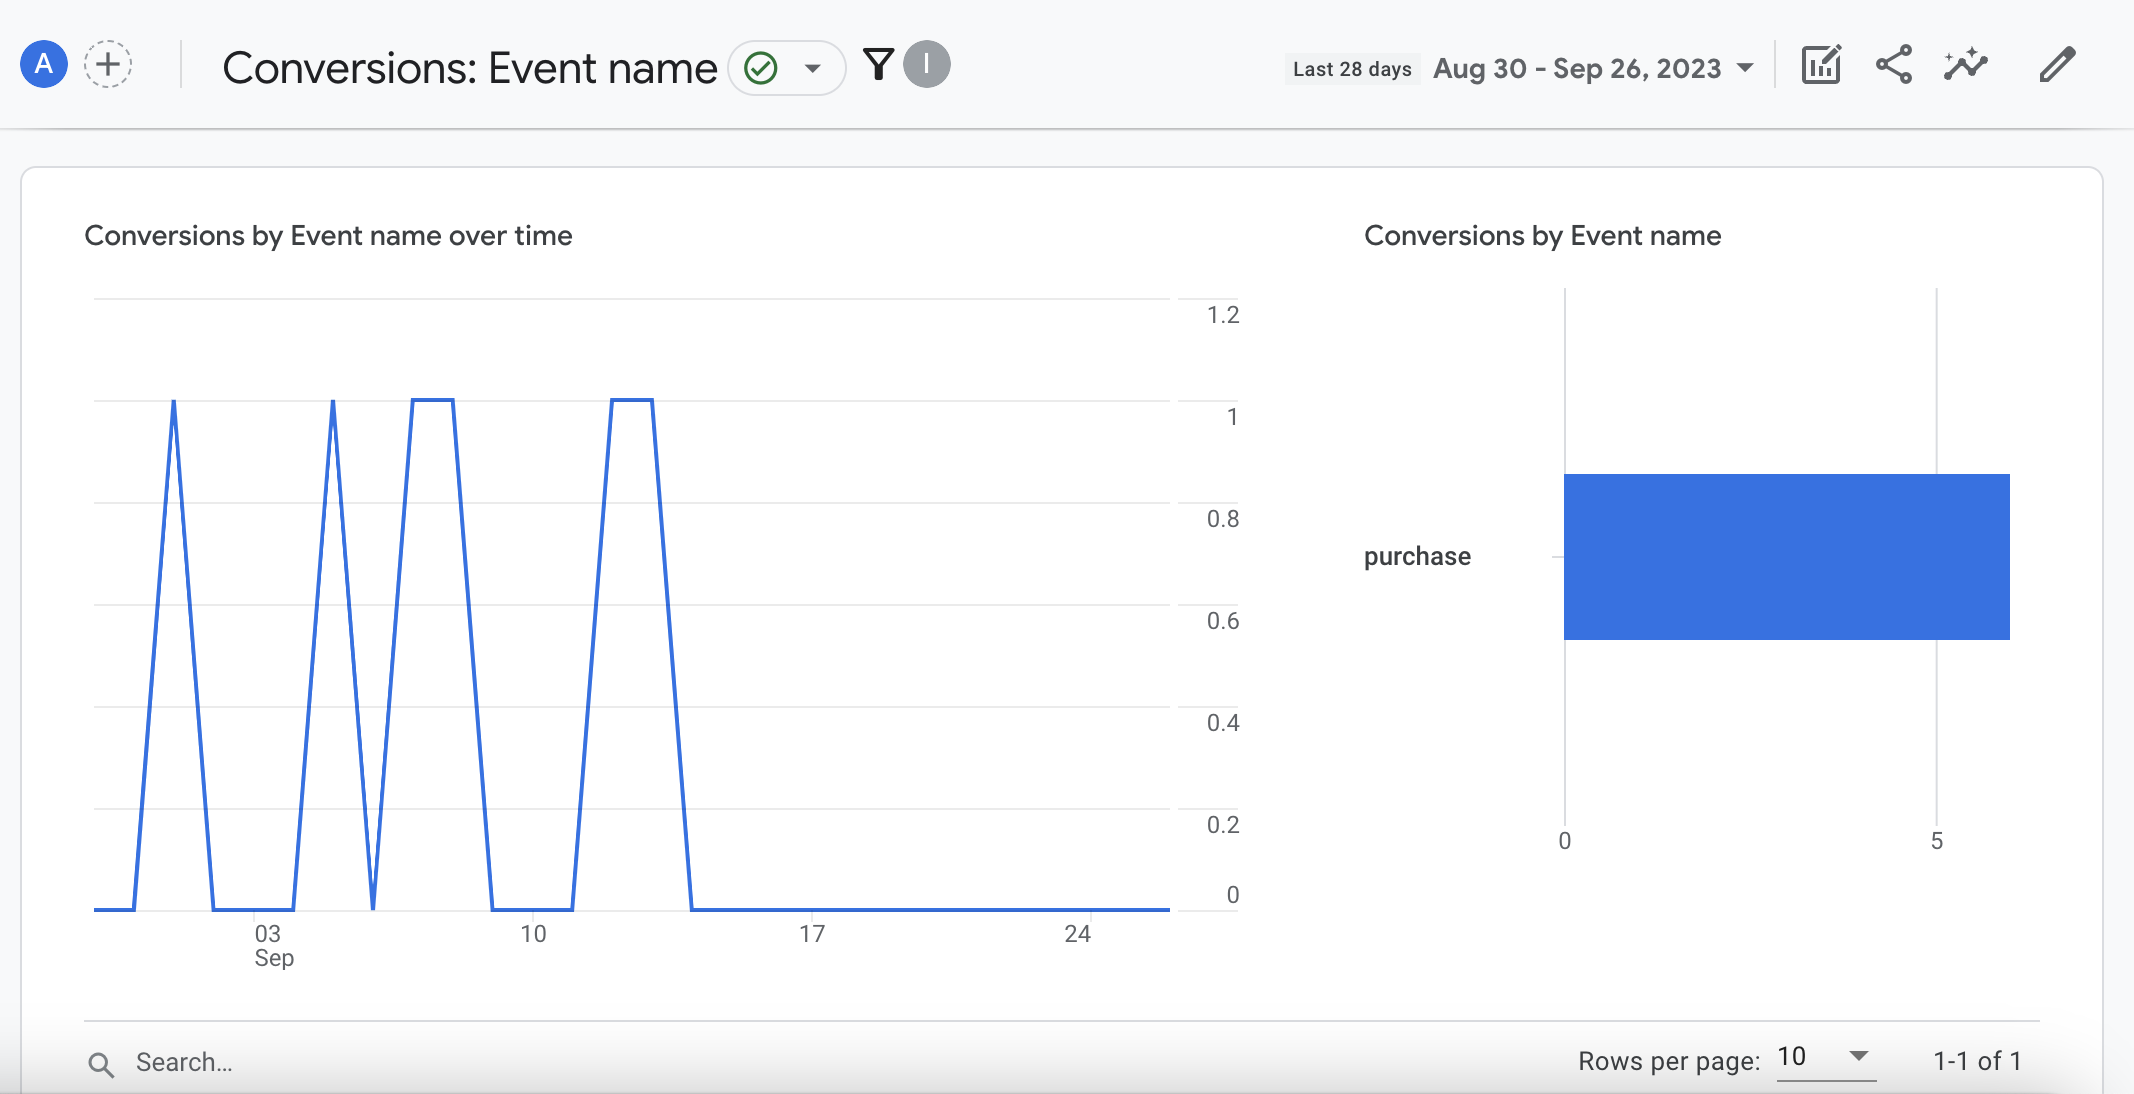
When you transition to GA4, you’ll notice a difference in conversion tracking. GA4 uses an event-based system, meaning that every site conversion is treated as an event rather than a page view. This means that every user action on your site is tracked as an event.
The addition of events in GA4 brings more advanced conversion tracking methods with advantages. One of the most significant advantages is conversion modeling.
Conversion modeling uses GA4’s machine learning capabilities to estimate the number of conversions that may have been missed due to data gaps or missing data. The machine learning model uses data from users who have converted and those who haven’t in your custom conversions. This allows you to identify patterns and correlations that can indicate which user behaviors are likely to lead to conversions.
In addition to conversion modeling, cross-device tracking is also added. This allows you to track how users convert on your website or mobile app, making tracking conversions in GA4 much easier than in Universal Analytics.
Another advanced conversion tracking method added to events in GA4 is conversion modeling.
Conversion modeling uses GA4’s machine learning capabilities to estimate the number of conversions that may have been missed due to data gaps or missing data. The machine learning model uses data from users who have converted and those who haven’t in your custom conversions. This allows you to identify patterns and correlations that can indicate which user behaviors are likely to lead to conversions.
In addition to conversion modeling, cross-device tracking is also added. This allows you to track how users convert on your website or mobile app, making tracking conversions in GA4 much easier than in Universal Analytics.
One of the most popular metrics in Universal Analytics is the bounce rate, which provides valuable insights. It measures the percentage of sessions on your website that consist of a single page view.
However, in GA4, the definition of bounce rate is different. The bounce rate in GA4 is defined as the percentage of sessions where no interactions were made.
When using Google Analytics 4, it’s recommended to focus on the engagement rate rather than bounce rates, which is a more useful metric. The engagement rate in GA4 measures the percentage of sessions where interactions were made. Analyzing which pages have low engagement rates can help you strategize on how to improve engagement on those pages.
In Universal Analytics, creating multiple views within a property was an industry standard. Typically, this was done to segment and filter out data that wasn’t valuable for your business.
When you transition to Google Analytics 4, you won’t see the filters you’re accustomed to. Instead, GA4 only has two “data filters”: “developer traffic” and “internal traffic.”
The developer traffic filter allows developers to exclude their own traffic from the analysis data. These filters are automatically applied to every GA4 property when created. (It’s worth noting that these filters may not capture all tests that developers conduct on your site, as they’re not foolproof.)
The internal traffic filter in GA4 is a predefined filter that allows website or app owners to exclude traffic from their organization’s network or devices.
All other filters you could add in GA4 are these. You cannot exclude specific IP addresses, cannot include only certain countries of operation, or segment your site’s content into sections as you could with Universal Analytics.
This means that in GA4, all traffic is very much like the “unfiltered” view in Universal Analytics. This means that you can make assumptions about your data and users that may not be valid for your business.
While GA4 has fewer robust filters compared to Universal Analytics, there are still several ways to create views in GA4. The best way to create “views” in GA4, in our recommendation, is to create custom reports using the filters available there.
For example, if you want to look at a conversion event specifically for Istanbul, you would create a custom report and add a “City = Istanbul” filter view. You can apply this logic to other segments you want to view, such as channel grouping, all events, and more.
These are just eight of the fundamental differences between Google Analytics 4 and Universal Analytics. There are numerous differences between the two platforms, but ultimately, transitioning to GA4 will allow you to better understand the actions users take on your website or app.
Error: Contact form not found.
Get an Offer


Join Us So You Don't
Miss Out on Digital Marketing News!
Join the Digipeak Newsletter.
Related Posts

The B2B growth landscape isn’t just about having the best tools; it’s about having the …

From the Desk of Digipeak: In a digital world where 98% of real estate leads …

Like any other data leak, Yandex is in a very tough spot. What happened is …

Market research is the process of gathering information about your business's market, target audience, and …