
Retention Metrics: Which to Track by Business Model (Formulas + Benchmarks)
Most teams track the wrong retention metric for their business, then wonder why the number …


 ★★★★★ 5.0 · 100+ reviews








Table of Contents
MEET OUR TEAM!
Somewhere on your site right now, a visitor who wanted to buy is clicking the same button three times in a second and then leaving. They are not confused about whether they want your product. They want it, they are trying to act, and something on the page is stopping them. That pattern has a name. A rage click is three or more clicks on the same element within one to two seconds, and it is one of the few metrics that points at a specific broken thing rather than a vague trend. Unlike bounce rate, which tells you people left, a rage click tells you exactly which element they were fighting when they gave up.
This matters commercially more than most teams realize, because rage clicks flag a specific kind of lost revenue: the high-intent kind. These are not window-shoppers drifting away. They are users far enough down the funnel to be clicking your call to action, blocked by a problem you can usually fix in an afternoon. Across the sites we audit, sessions containing rage clicks convert dramatically lower than clean sessions, and the users inside them are exactly the ones you already paid to acquire. Fixing the cause recovers conversions you have already earned the right to.
This guide is a diagnostic workflow, not a theory piece. It walks through detecting where rage clicks cluster on your site, quantifying the revenue they are costing so you can prioritize, fixing the handful of causes that produce almost all of them, and re-measuring to confirm the fix held. It is deliberately tool-neutral: the method works with any session-replay or heatmap product, because the discipline matters more than the vendor. By the end you will have a repeatable sprint you can run this week.
A rage click is three or more clicks on the same page element within a short window, typically one to two seconds, signaling that a user expected something to happen and it did not. The rapid repetition is the tell. A single click is normal. Three fast clicks on the same spot is a person expressing frustration with their mouse or thumb, and it almost always means the element is broken, slow, misleading, or not actually clickable.
It helps to separate three related frustration signals, because they have different causes and different fixes. A rage click is repeated clicking on the same element. A dead click is a click on something that looks interactive but does nothing at all, an image that seems tappable, a bit of text styled like a link. An error click is a click that triggers a visible error or a silent failure, like a form submission that clears the page without explaining why. All three are friction signals, and all three cost conversions, but the rage click is the loudest because the user is telling you, through repetition, that they genuinely wanted the thing to work.
The reason these signals are more useful than traditional analytics is specificity. Conversion rate tells you the outcome. Bounce rate tells you people left. Neither tells you what to fix. A rage-click hotspot points at a single element on a single page and says: this is where the intent-rich users are losing the fight. That is a work order, not a trend line.
The instinct is to weigh rage clicks by how often they happen. That undercounts their cost, because the users doing them are unusually valuable. A rage click only happens after a user has engaged enough to try to act, which means the population of rage-clicking sessions is skewed toward high intent. Losing them is not like losing a bounce from the homepage; it is like losing a shopper at the register.
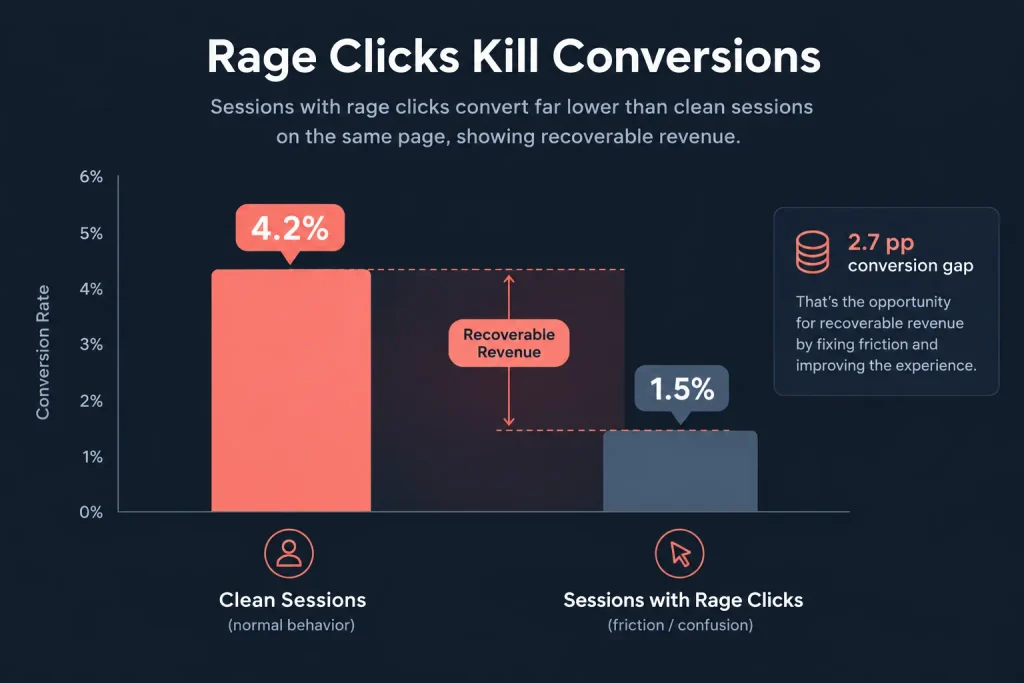
The revenue math is straightforward once you frame it as a gap between two conversion rates. Take the pricing or checkout page where a rage-click hotspot lives. Measure the conversion rate of sessions that contained a rage click against the conversion rate of clean sessions on the same page. In the pattern we see repeatedly, the frustrated sessions convert at a fraction of the clean rate, and because they are high-intent to begin with, closing that gap is pure recovered revenue rather than net-new demand you have to go create.
A simple worked example makes the size of the leak visible. Suppose 12 percent of the sessions reaching your pricing page contain a rage click, those sessions convert at 1.5 percent, and clean sessions on the same page convert at 4.2 percent. The frustrated segment is converting at roughly a third of its potential. If that page sees meaningful traffic, the recovered conversions from closing even part of that gap usually dwarf the cost of the fix, which is often a single CSS or JavaScript change. This is why rage-click work sits among the highest-ROI moves in conversion rate optimization: the demand already exists, and you are removing the barrier rather than manufacturing new interest.
Peaker Note: The Friday-Night Deploy That Quietly Costs a Weekend of Sales
The most common rage-click story Digipeak finds in audits is not a design flaw, it is a silent breakage. A theme update ships late Friday, or a developer edits a snippet and does not test the mobile view, and a button quietly loses its click handler…
Detection is the first step because you cannot fix what you cannot see, and rage clicks are invisible in conventional analytics. The method is the same regardless of which tool you use.
Turn on the frustration signal. Any modern session-replay or heatmap platform can flag rage clicks and dead clicks automatically. The specific product does not matter; what matters is that the signal is being captured at all, because most teams have the capability sitting unused inside a tool they already pay for.
Filter replays to frustrated sessions only. The point of the tooling is not to watch hundreds of recordings. It is to filter the replay list down to only the sessions that contained a rage click, then watch those. This turns an impossible manual task into a focused 30-minute review, because you are looking exclusively at sessions where something went wrong.
Read the click-density and heatmap view. Heatmaps surface where clicks concentrate on non-interactive areas, which is the fingerprint of a dead-click problem. A bright cluster on an image, a heading, or an empty area of the layout means users think that thing is clickable and it is not.
Normalize before you trust a hotspot. Not every cluster is a real problem. Filter out bot traffic, separate by device (a hotspot that only appears on mobile is a different fix than one on desktop), and separate by page type. A rage-click rate that looks alarming site-wide often traces to one template, which is good news because it means one fix propagates everywhere that template is used.
The output of Step 1 is a ranked list of hotspots: specific elements, on specific pages, on specific devices, where intent-rich users are getting stuck. That list is the raw material for everything that follows.
A list of hotspots is not yet a plan, because not every hotspot is worth fixing first. Prioritization is what separates a productive rage-click sprint from a busywork one, and it rests on combining three factors into a simple severity score.
Frequency: how many sessions hit this hotspot. A rage click on a low-traffic page matters less than one on a high-traffic template, all else equal.
Position in the funnel: where the hotspot sits. A rage click on the checkout button or the pricing-page call to action is worth far more than one in the site footer, because the funnel position determines how close the frustrated user was to converting.
Exit impact: what happens after the rage click. A hotspot where most frustrated sessions then abandon the page is more urgent than one where users recover and continue. The exit rate that follows a rage click is the clearest signal of how much revenue the hotspot is actually bleeding.
Combining these into a rough severity score (frequency times funnel weight times exit impact) ranks the hotspots by recoverable revenue rather than by raw click count. The top of that ranked list is almost always a small number of elements, which is the encouraging part: fixing the top three hotspots on a site typically captures the large majority of the available lift, because friction, like most things, follows a concentration pattern where a few elements cause most of the damage.
Before fixing, it helps to recognize which of the recurring causes each hotspot belongs to, because the cause determines the fix.
| Cause | What the User Experiences | Typical Fix |
|---|---|---|
| Broken or unbound CTA | Clicks the button, nothing happens | Restore the click handler; test critical CTAs daily |
| Dead click (looks clickable) | Taps an image or text expecting action | Remove false affordance, or make it actually interactive |
| Slow response / no feedback | Clicks, sees no acknowledgment, clicks again | Add loading state; respond within 100ms perceived |
| Misleading UI state | Clicks a disabled control that looks active | Visually disable inactive elements (opacity, cursor) |
| Silent form failure | Submits, page clears with no error shown | Show clear inline validation errors |
| Broken infinite scroll | Scrolls, nothing loads, scrolls again | Add a loading indicator and a pagination fallback |
The reassuring reality of rage-click work is that a short list of causes produces the overwhelming majority of the problem. Fixing them is usually cheap, because the issue is rarely a deep architectural flaw and usually a small break, a false signal, or a missing piece of feedback.
The most expensive rage click is on a call to action that does nothing, because the user was ready to convert. The causes are a JavaScript error breaking the click handler, a payment or API call failing silently, or form validation blocking submission without showing why. The fix is partly preventive: test your critical conversion CTAs daily, ideally with automated monitoring, so a break is caught in hours rather than discovered in next month’s revenue report. When a CTA can fail, it should fail loudly with a clear message and a fallback path, never silently.
Users tap things that look interactive. An image styled to feel like a button, a heading that resembles a link, a product photo that begs to be zoomed but does nothing. The fix is one of two directions: either remove the false signal so the element clearly is not interactive, or honor the expectation and make it actually work. Product-image zoom on mobile is the near-universal example, and the fix is small, ship a tap-to-zoom lightbox or add a visible zoom cue, and a common source of frustration disappears.
A large share of rage clicks are not caused by broken elements at all, but by elements that work slowly and say nothing while they work. The user clicks, sees no acknowledgment, assumes the click failed, and clicks again. The fix is feedback, not speed alone: every interactive element should acknowledge input within about 100 milliseconds, the threshold where a response feels instant, even if the underlying action takes longer. A button that immediately shows a loading state stops the second and third click before they happen.
Take Advantage of Automation with Artificial Intelligence!
How can you use your time more efficiently? Artificial intelligence saves you time by automating repetitive tasks. Learn how you can leverage AI to accelerate your business processes.
Two related causes round out the list. A control that is disabled but still looks active invites clicks that go nowhere; visually disabling it (reduced opacity, a not-allowed cursor) sets the right expectation. And a form that fails silently, clearing the page or doing nothing on submit without surfacing an error, produces some of the most damaging rage clicks because the user did everything right. Clear, inline validation that appears exactly where the problem is turns a rage-quit into a completed action.
None of these fixes is a redesign. They are targeted corrections, which is what makes rage-click work a genuine quick win rather than a project. The same discipline underpins broader e-commerce conversion work, where removing friction from the path to purchase reliably outperforms adding new persuasion to it.
A fix is a hypothesis until the data confirms it. The final step is verification, and it protects you from the trap of a change that stops the rage click but introduces a new problem, like disabling a button to prevent frustrated clicks and accidentally blocking legitimate re-submissions.
Validate the fix, ideally with a split test. Where traffic allows, serve the original and the fixed version to split traffic and compare rage-click rate, conversion rate, and task-completion time together. Watching all three prevents a fix that improves one metric while quietly harming another.
Confirm the drop held for a full cycle. After deploying the winning version to all traffic, monitor for one full business cycle, usually a week, to confirm the rage-click rate on that element dropped and stayed down. Watch a few fresh sessions to see the experience is genuinely clean now.
Make monitoring continuous, not one-time. This is the most important shift. Rage clicks are not a problem you solve once; they reappear after theme updates, third-party script changes, and traffic shifts from new sources. A light weekly triage (check for new frustrated-session clusters, especially after any deploy) and a monthly trend read (track site-wide rage-click rate as a percentage of sessions, and watch for it climbing) turns rage-click work from an audit into an early-warning system. The measurement discipline here connects to the wider point that you cannot fix what you cannot see, the same principle behind sound server-side tracking and analytics setups.
Your Visuals Stand Out But You're Not Getting Any Feedback?
Get a Free Design Audit Now!
Let's evaluate together how you can better engage with your target audience visually, dysfunctional designs, and tips to increase engagement. Fill out the form now and get your free analysis report!
A rage click is three or more clicks on the same page element within a short window, usually one to two seconds, signaling user frustration. It almost always means the element is broken, slow, misleading, or not actually clickable. Unlike bounce rate, which only tells you a user left, a rage click points at the specific element the user was fighting, which makes it one of the most actionable signals in conversion rate optimization.
The most common causes are unresponsive or broken buttons (a JavaScript error or silent API failure breaks the click handler), dead clicks on elements that look interactive but are not, slow responses with no loading feedback so the user clicks again, misleading UI states such as a disabled control that looks active, and silent form failures that clear the page without showing an error. Most rage clicks trace to one of these, and most are cheap to fix.
Rage clicks disproportionately affect conversion because the users doing them are high-intent, they only happen after someone has engaged enough to try to act. Sessions containing rage clicks convert substantially lower than clean sessions on the same page. Because these are users you already paid to acquire and who already wanted to convert, fixing the cause recovers revenue that already exists rather than requiring new demand, which is what makes it high-ROI CRO work.
Turn on rage-click and dead-click detection in any session-replay or heatmap tool, then filter the recordings to show only sessions that contained a rage click and watch those. Use click-density heatmaps to spot clusters on non-interactive elements. Normalize the data by removing bot traffic and separating by device and page type, so you can tell a genuine hotspot from noise. The output is a ranked list of specific elements where users are getting stuck.
The lift depends on where the hotspots sit and how much traffic they affect, but fixing the top few rage-click hotspots on a site commonly recovers a meaningful share of the conversion gap between frustrated and clean sessions on the affected pages. Because the fixes are usually small (a restored click handler, a loading state, a validation message) and the users are high-intent, the return on the effort is typically high relative to its cost. The honest way to size it for your own site is to measure the frustrated-versus-clean conversion gap on your highest-traffic conversion pages.
A rage click is repeated rapid clicking on the same element, signaling frustration that something is not working as expected. A dead click is a single click on an element that looks interactive but does nothing at all, like an image or heading styled to feel clickable. Dead clicks often lead to rage clicks: the user taps once, nothing happens, and then taps repeatedly. Both are friction signals, and a session-replay tool typically detects both.
Almost always, because they indicate accidental friction the user did not expect and cannot get past. The one nuance is distinguishing accidental friction from strategic friction. A deliberate confirmation step or a qualifying question is designed resistance the user understands, whereas a rage click is an unplanned wall. The goal is to remove the accidental walls while leaving intentional, conversion-protecting steps in place, so rage-click data should be pointed at genuine breakage rather than used to justify stripping every pause from a flow.
Rage clicks are the rare conversion problem where the hard part, creating demand, is already done. The user found you, engaged, and tried to convert. All that stands between them and the sale is a broken button, a dead image, a missing loading state, or a silent form error. Fixing those is not a redesign or a strategy overhaul; it is a diagnostic sprint that any team can run in a week and that pays back faster than almost any other conversion work, because you are recovering revenue that already exists rather than manufacturing new interest.
Three steps for tomorrow: turn on rage-click detection in the session tool you almost certainly already pay for and filter to frustrated sessions, measure the conversion gap between rage-click and clean sessions on your single highest-traffic conversion page to size the leak, and fix the top hotspot, then re-measure to confirm it held. That loop, run continuously rather than once, turns a hidden revenue leak into an early-warning system that catches the next broken button in hours instead of quarters.
A forward look: as more teams adopt behavior-first optimization over hypothesis-based testing, frustration signals like rage clicks are moving from a niche session-replay feature to a primary CRO input. The sites that build the detect-quantify-fix-remeasure loop into their weekly rhythm now will be the ones catching friction before it compounds, while competitors still learn about broken elements from a disappointing revenue report at the end of the month.
At Digipeak, rage-click work is run as a conversion friction audit rather than a vague CRO retainer. Every engagement opens by turning on frustration-signal detection, filtering to the sessions where high-intent users got stuck, and quantifying the revenue gap between frustrated and clean sessions on the pages that matter most, the checkout, the pricing page, the primary lead form. That audit turns an invisible leak into a ranked, costed fix list, which is usually what makes the business case for the work obvious. It sits inside the broader conversion rate optimization practice that treats removing friction as a higher-return lever than adding persuasion.
The fixes are then implemented and verified with the split-test-and-re-measure discipline that separates a real improvement from a change that merely looks good, and monitoring is left running so the next regression is caught in the weekly triage rather than the quarterly numbers. Because rage-click fixes are small and specific, this is some of the fastest-returning work in the CRO practice, which is why Digipeak treats it as an early, high-trust entry point with new clients.
Digipeak operates as a 360-degree growth agency from offices in London, Istanbul, and Texas, holds Google and Meta Partner status, and runs conversion friction work alongside the paid media, analytics, and lifecycle programs that depend on a site actually converting the traffic they send it. If your conversion rate has dipped without an obvious cause, a rage-click audit is often where the missing revenue turns up.

Join the
Digipeak Newsletter!
Stay up to date with the latest digital marketing insights, trends, and updates. Subscribe today!
Related Articles
Most teams track the wrong retention metric for their business, then wonder why the number …
The term retention marketing gets used interchangeably with at least six other terms it is …

Most companies’ marketing budgets are structured for a world that no longer exists. They allocate …


